Understanding the Dashboard
Overview
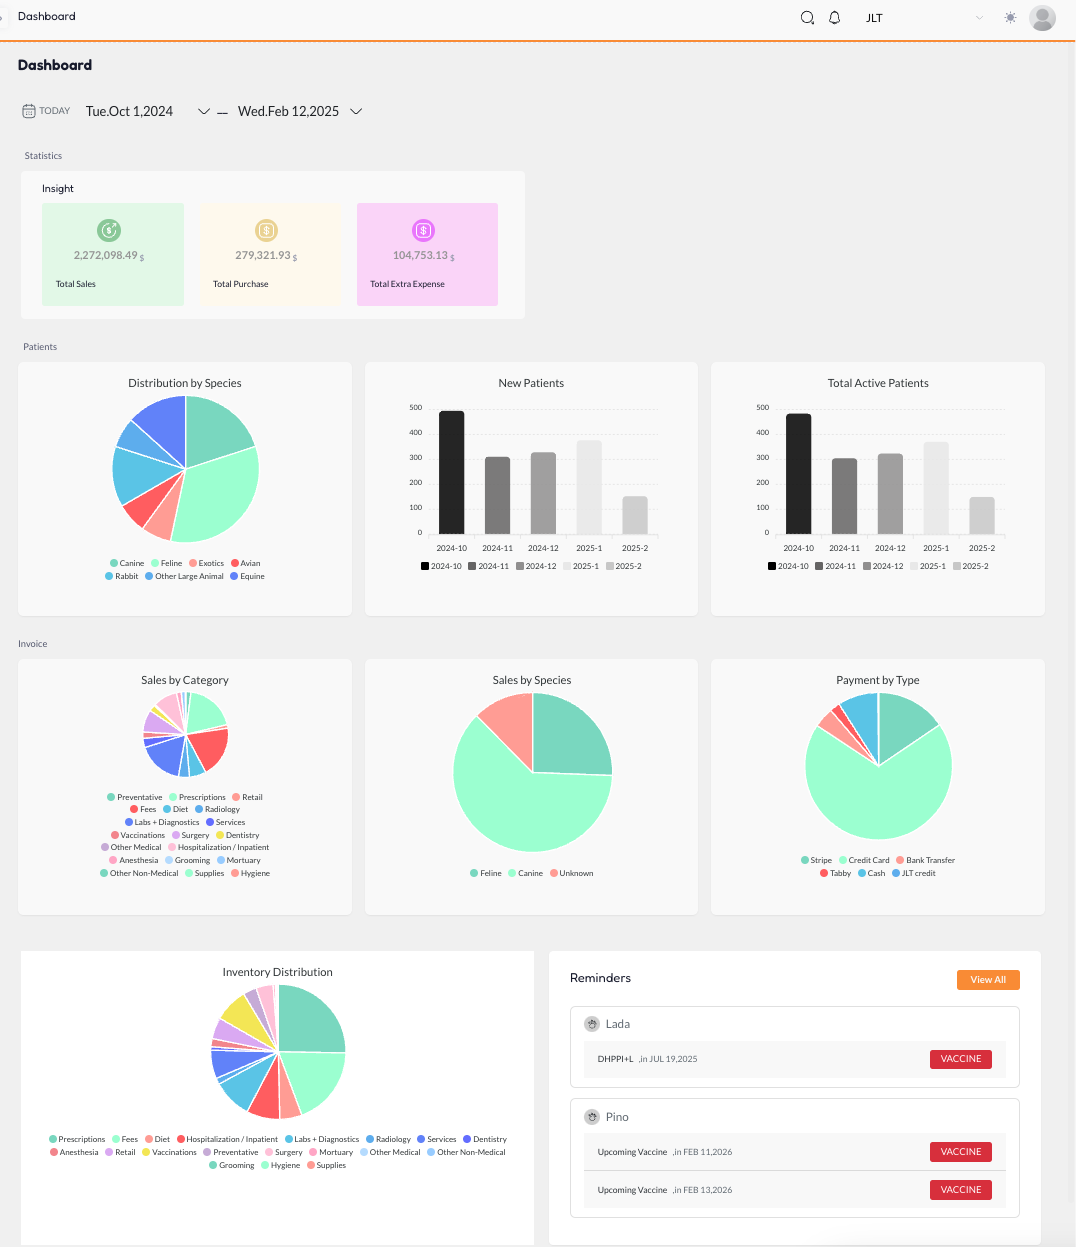
When you log in to viggoVet, the first thing you see is the Dashboard. This is your control center, providing key insights into clinic performance, patient trends, and financial statistics. The dashboard is designed to be role-based, meaning certain charts and data points will be visible or hidden depending on your user permissions.
Each clinic also has a customizable color theme, making it easy to identify which clinic you're currently working in. If you have multiple clinics, this helps differentiate them with unique accent colors for buttons and the top bar under the header.
Dashboard Layout & Key Features
1. Top Navigation Bar
At the top right, you will find:
- Profile Dropdown – Change language, sign out, or access profile settings.
- System Color Mode – Switch between Light Mode, Dark Mode, or System Default.
- Clinic Switcher (Multi-Clinic Accounts) –Dynamically switch between clinics without losing your current workflow. If you're viewing a report, patient profile, or invoices, changing the clinic will automatically reload the relevant data for the selected clinic.
- Notification Bell Icon – Displays real-time notifications and tasks with a smooth animation when new notifications arrive.
- Universal Search (🔍 Icon) – Quickly search for anything in the system, including patients, invoices, and reports.
Dashboard widgets are Role & Permissions-based
2. Dashboard Statistics & Insights
At the top of the dashboard, key financial insights are displayed:
- Total Sales – The total revenue generated by the clinic.
- Total Purchases – The total amount spent on purchases.
- Total Extra Expenses – Additional costs incurred by the clinic.
These figures help you track overall clinic performance at a glance.
3. Patients Overview
The Patients section provides insights into patient demographics and trends:
- Distribution by Species – A pie chart showing patient distribution (Canine, Feline, Exotic, Avian, etc.).
- New Patients – A bar chart displaying new patient registrations over time.
- Total Active Patients – Tracks how many patients are actively receiving care.
4. Invoices & Sales Insights
The Invoices section gives financial breakdowns for better revenue tracking:
- Sales by Category – See which services/products generate the most revenue.
- Sales by Species – Revenue generated from different patient species.
- Payment by Type – A breakdown of payment methods (Stripe, Credit Card, Bank Transfer, Cash, etc.).
5. Inventory Distribution
This section provides a pie chart of inventory categories, helping clinics manage stock levels efficiently. Categories include:
- Prescriptions, Anesthesia, Retail, Preventative care, Hygiene, and more.
6. Reminders & Upcoming Tasks
The Reminders panel keeps you informed of upcoming medical follow-ups, including:
- Vaccination Reminders – Alerts for upcoming patient vaccinations.
- Medication Refills & Follow-ups – Ensuring patients get the necessary ongoing care.
A View All button lets you check the full list of reminders for better client follow-ups.
Dashboard Thoughts
- Multi-Clinic Support – Effortlessly switch clinics while keeping the workflow seamless.
- Custom Themes – Color-coded interfaces make it easy to differentiate between clinics.
- Dynamic Data Loading – Changing clinics updates the data instantly without extra steps.
- Role-Based Visibility – Users only see relevant data based on their permissions.
- Quick Navigation Tools – Search, notifications, and insights are always within reach.
With viggoVet, the dashboard is designed to save time, improve workflow efficiency, and provide real-time insights into clinic operations.